
Peaks Segmentation Widget#
The Peaks Segmentation widget is used to identify and extract diffraction peaks from a stack of 2D detector frames.
This widget allows you to visually fine-tune parameters on a single frame before launching a full-scan segmentation.
Functionality#
Single Frame Preview: Real-time visual feedback of how your parameters (thresholds, sigmas, cuts) affect peak detection on a selected frame.
Algorithm Selection:
Gaussian Peak Search (ImageD11): Ideal for traditional Frelon detectors.
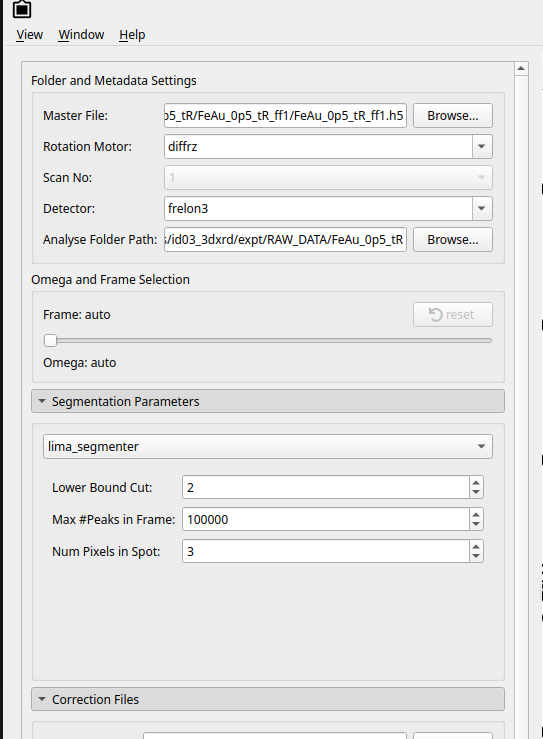
Lima Segmenter: Optimized for high-speed Eiger detectors.
Background Correction (Optional): Integration of dark fields, flat fields, and mask files to clean data before peak searching.
3D Merging: When executed, the widget processes the entire scan, merges 2D peaks across frames into 3D peaks, and calculates their center of mass in \((f_{raw},s_{raw},\omega)\).
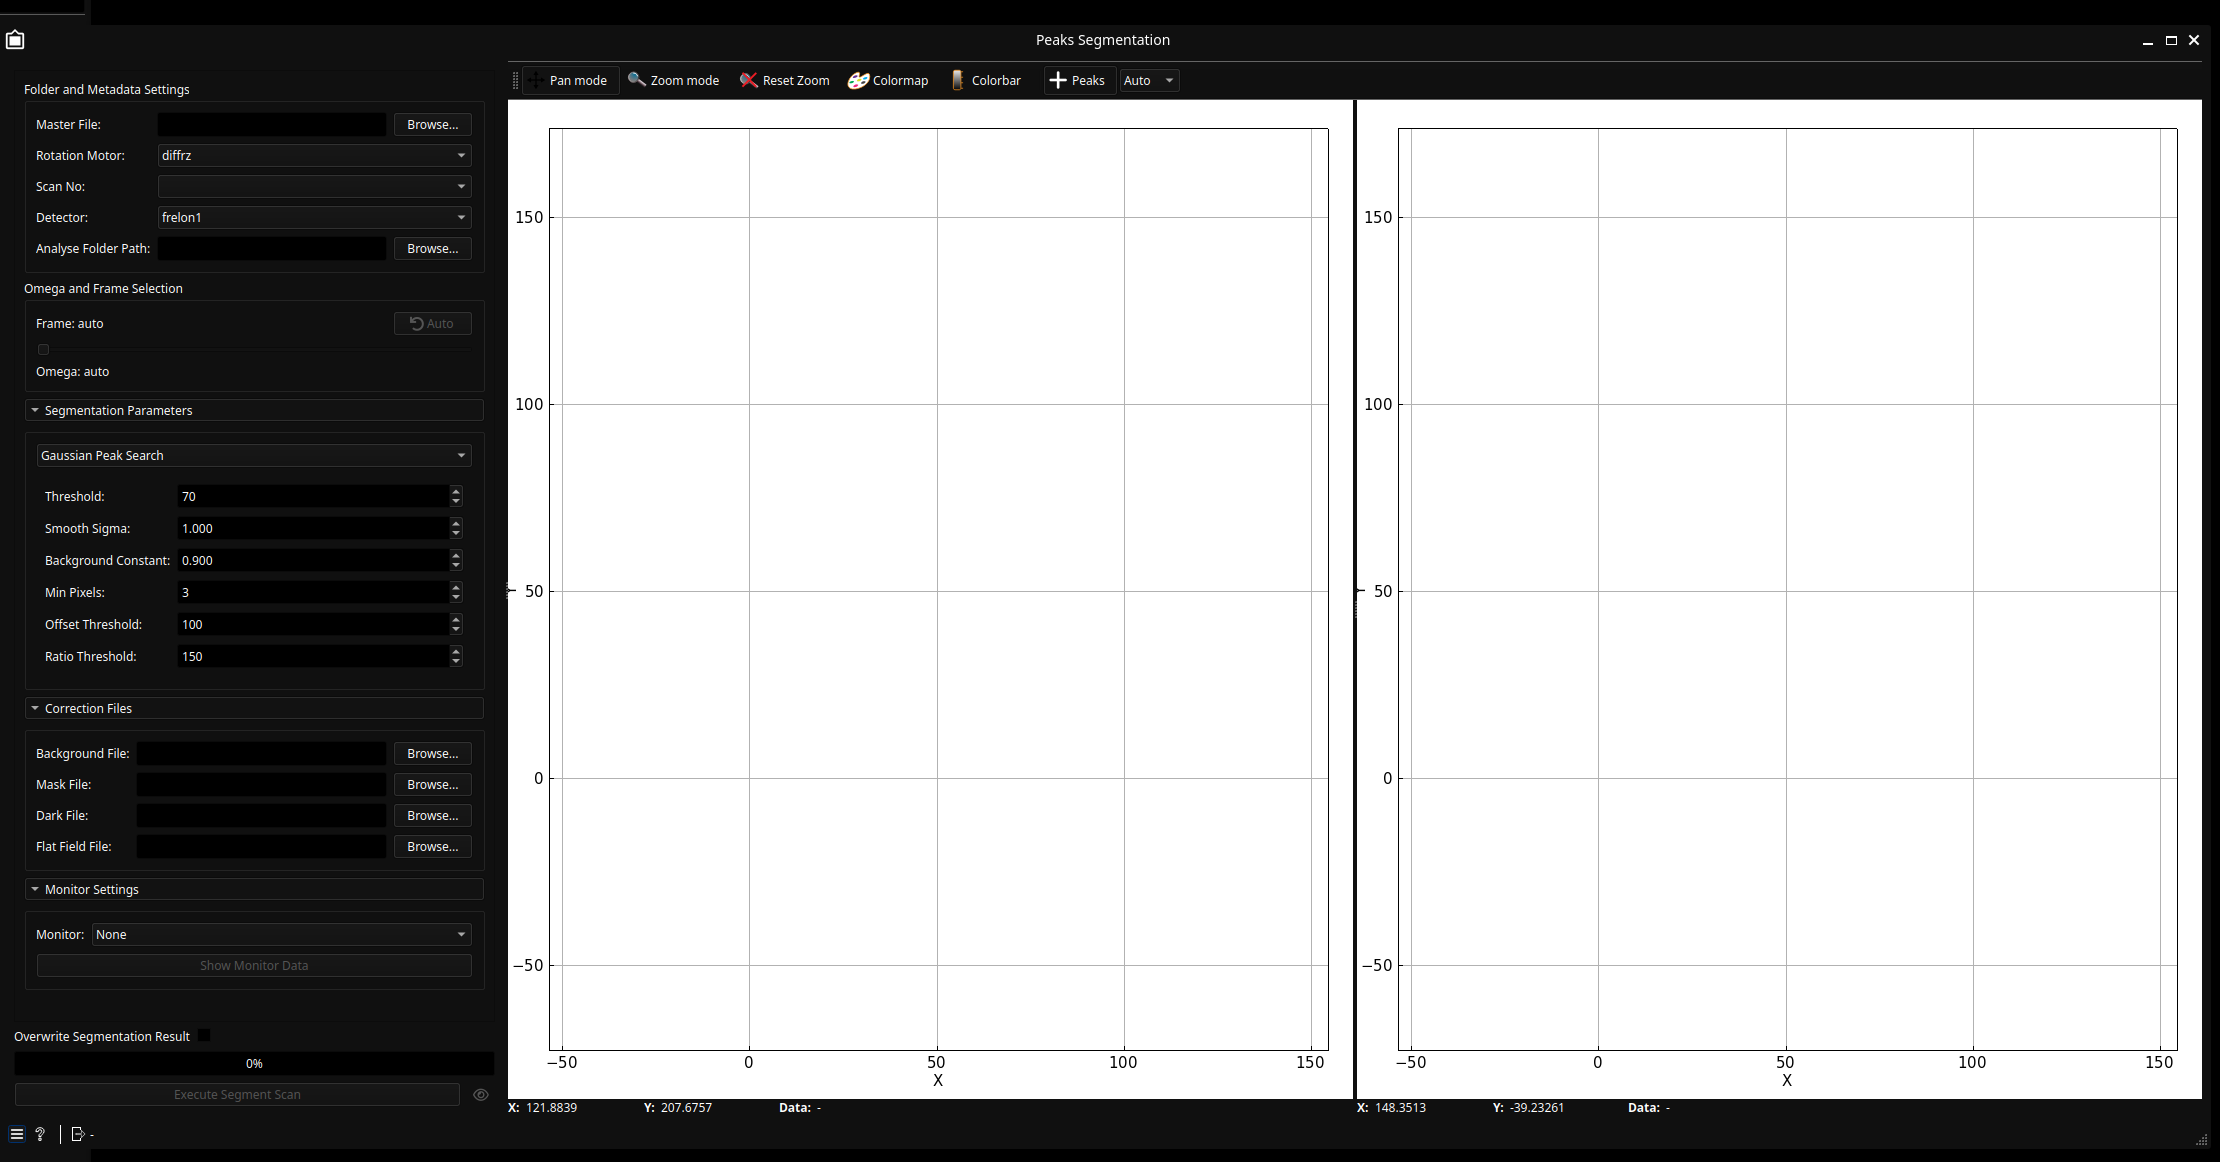
User Interface#
The widget is divided into a Settings Panel (left) and a Dual Plot Preview (right).
Left Plot (Corrected): Displays the image after background subtraction and smoothing.
Right Plot (Raw + Peaks): Displays the raw data with detected peaks overlaid as scatter points (marked with “x”).
Tip
In this context, “Peaks” refer to the diffraction spots (reflections) captured on the detector during the experiment.
Control Panel#
Gaussian Peak Search |
Lima Segmenter |
|---|---|
|
|
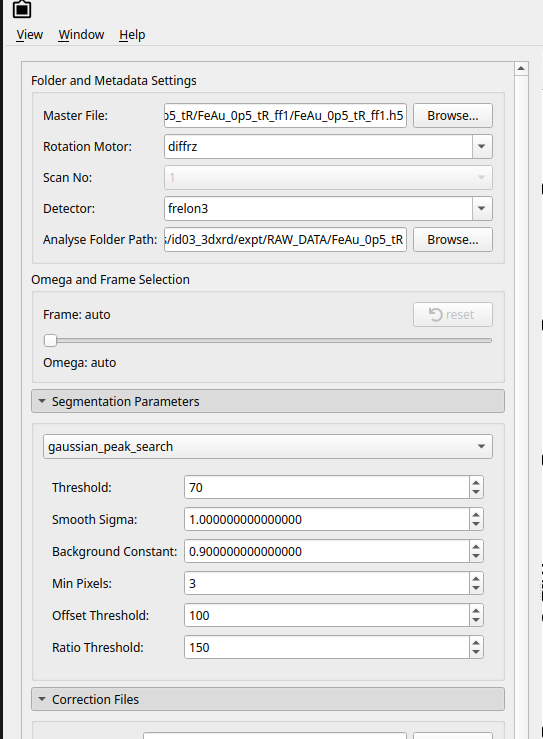
Folder & Scan Configuration:
Master File: The HDF5/Nexus file containing the raw scan data information.
Scan Number: The specific scan entry to process.
Detector: Select or type the detector group (e.g., eiger, frelon1, frelon3, etc).
Omega Motor: Select or type the omega motor used in the raw data acquisition.
Frame Index: Choose a specific frame (e.g., a frame where peaks are clearly visible) to test your parameters (as follows).
Algorithm Parameters: The available settings change based on the selected algorithm:
Gaussian Peak Search (ImageD11)
Threshold: Minimum pixel intensity (in ADU) to be considered a potential peak.
Smooth Sigma: Gaussian blur sigma value used for background smoothing.
Min Pixels (minpx): The minimum number of connected pixels required to form a valid peak.
BGC: Fractional part of background per peak to remove.
offset_threshold: Set intensity to a constant if it is less than this value.
ratio_threshold: Used to filter out peaks with an intensity higher than this value.
Tip
The behavior of offset_threshold and ratio_threshold changes significantly depending on whether a Background File is provided. Without a background file,
ImageD11performs a local mean subtraction; with a file, it performs a direct subtraction.Lima Segmenter (ImageD11)
Lower Bound Cut: Intensity floor for pixel consideration.
Max Pixels per Frame: A safety limit to prevent memory overflow in extremely noisy data.
Num Pixels in Spot: Defines the connectivity logic for identifying a single peak.
Correction Files:
Background File: Optional Background File to correct the scan background Noise.
Mask File: Optional Mask file to remove the detector weak spots from the frames.
Dark File: Optional Dark file to correct the dark correction in the scan.
Execution Control#
Overwrite: If checked, existing segmentation data in the Nexus file will be replaced.
Segment Scan: This button triggers the Ewoks Task (SegmentScan) which processes every frame in the scan using the current settings.
Tuning & Automation#
To find the suitable parameters for your entire experiment, follow this iterative process:
Tune on a Single Frame
Load your Master File and select a Scan Number.
Navigate to a Frame Index that contains representative peaks (not a dark frame).
Adjust the Threshold and Smooth Sigma.
Observe the Dual Plot:
If you see “noise” being picked up as peaks (tiny ‘x’ marks everywhere), increase the Threshold or Min Pixels.
If real peaks are being missed, lower the Threshold.
If a single peak is being split into many small ones, increase the Smooth Sigma.
Validate on Different Orientations Change the Frame Index to a different \(\omega\) position (e.g., start, middle, and end of the scan) to ensure your parameters are robust enough for the different angles in the rotation.
Automate the Full Scan Once the preview shows clean peak detection:
Click Segment Scan.
The progress bar will track the processing of all frames.
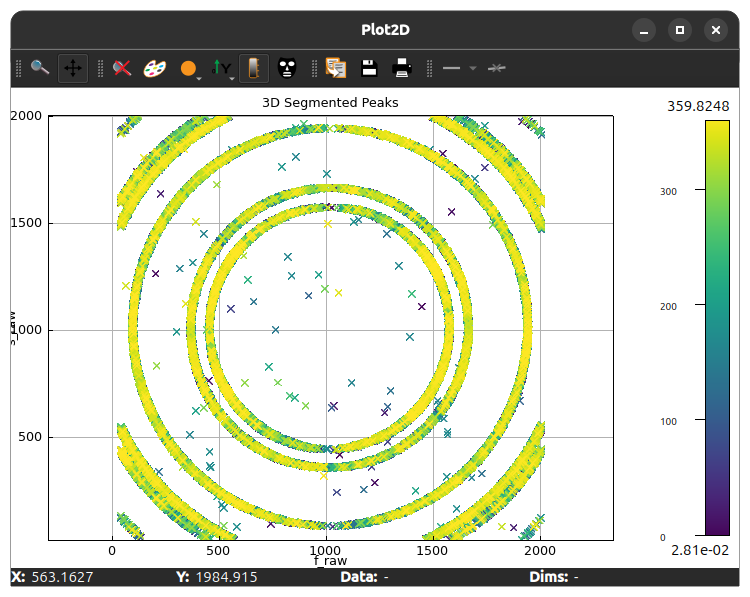
Result Visualization: Upon completion, a 3D scatter plot will automatically open, showing the merged peaks in \((f_{raw},s_{raw},\omega)\) space.
Example Usage#
After tuning your parameters to match the diffraction spots in the preview, the final execution will produce a consolidated 3D peak table ready for further data processing (Geometry Computation, Filtering, and Indexing).
Tip
If you closed the window showing the full segmentation results, you can show it again by clicking on the 👁️ button near the Execute Segment Scan.