Lattice Filter Widget#
The Lattice Filter widget is used to isolate diffraction peaks belonging to a specific crystal phase. By comparing the reciprocal distance \(ds\) of experimental peaks to the theoretical \(ds\) values of a given lattice, it filters out noise and peaks from other phases.
Functionality#
This widget is used for:
Define a Phase: Input lattice parameters and space group symmetry.
Apply Tolerance Filtering: Filter peaks that fall within a specific distance (\(\Delta ds\)) from theoretical diffraction rings.
Visual Verification: Compare “before and after” datasets overlaid with theoretical ring positions.
User Interface#
Control Panel#
Lattice Settings#
These parameters define the “mask” used for filtering.
Lattice Name: The identifier for the phase (e.g., “Fe”).
Lattice Parameters: Six values defining the unit cell:
\(a, b, c\) (in Å)
\(\alpha, \beta, \gamma\) (in degrees).
Space Group: The symmetry group number used to calculate allowed reflections.
Reciprocal Distance Tolerance (\(ds\) Tol): The maximum allowed deviation from a theoretical ring for a peak to be kept.
Max Reciprocal Distance (\(ds\) Max): (Optional) A hard cutoff for the maximum reciprocal distance to consider.
Execution Control#
Process Group Name: The specific HDF5/Nexus path where the filtered peak data will be stored
defaults to
lattice_filtered_peaksfor Lattice filtering.defaults to
intensity_filtered_peaksfor Intensity filtering.defaults to
indexer_filtered_peaksfor Indexer filtering.
Tip:
By assigning a unique name here (e.g., alpha_phase_peaks or beta_phase_peaks), you can process multiple phases within the same data file. This allows you to run independent Indexing and Grain Mapping tasks for each phase subsequently.
Filter Peaks: Executes the filtering.
Overwrite: If checked, existing groups with the same process name will be replaced.
Main View (Tabs)#
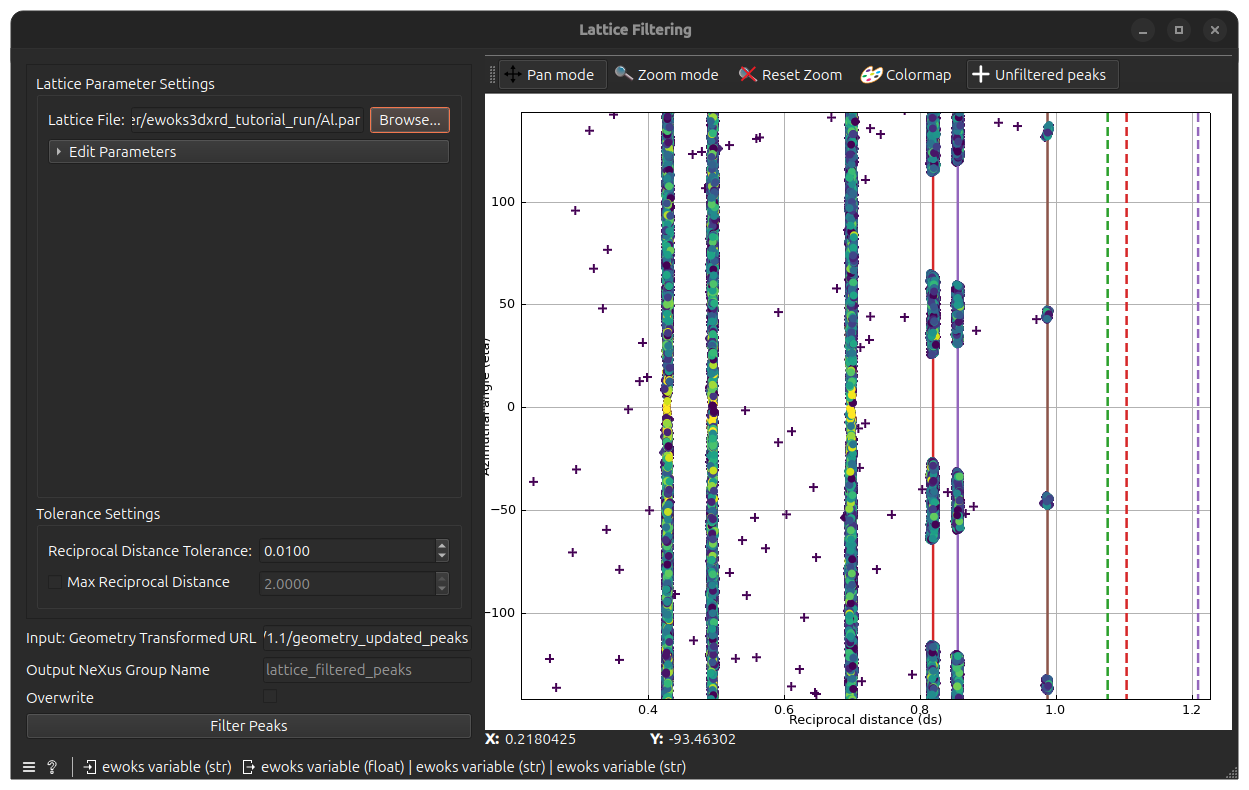
1. Filter Peaks Tab#
To show the filtering efficiency.
Unfiltered Data: Shown as a background scatter plot (\(ds\) vs \(\eta\)).
Filtered Data: Peaks that passed the lattice criteria are highlighted.
Lattice Rings: Theoretical vertical lines are drawn at calculated \(ds\) positions. If your peaks don’t align with these lines, check your lattice parameters or the previous Geometry Transformation step.
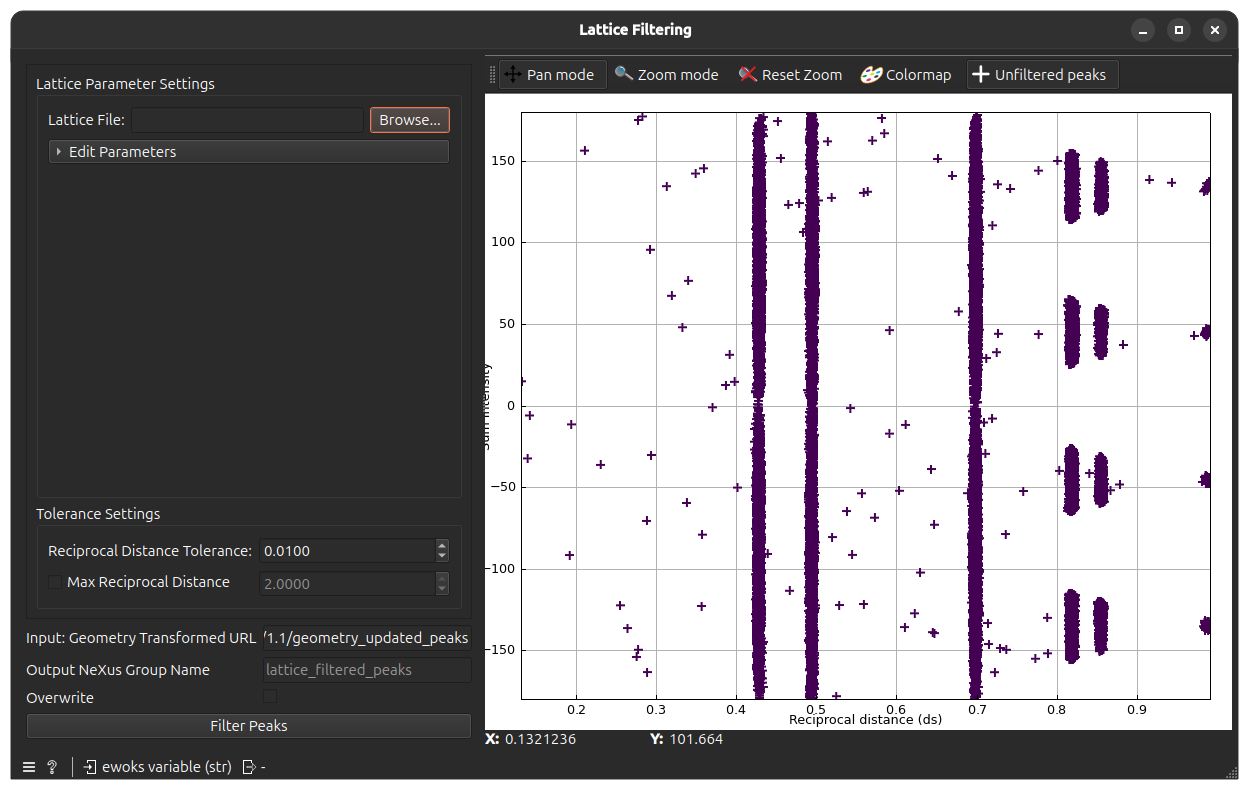
2. Custom Peak Analysis Tab#
Provides a adjustable plotting mechanism to verify the quality of the filtered peaks across other dimensions (e.g., Intensity vs \(\omega\), \(G\)-vector components, etc).
Example Usage#
Connect a widget that outputs a
geometry_transformation_urlor browse from your folder and select the geometry transformation data group.Select your lattice
.paror.ciffile in the LatticeBox.Set \(ds\) Tol, for example say 0.01.
Click Execute. The plot will show \(ds\) vs \(\eta\) plot.
Repeat the step 3 and 4 until you visually find the good \(ds\) Tol value that aligns the input peaks \(ds\) value aligns with provided lattice unit cell parameters.