Index Filter Widget#
The Index Filter widget provides a graphical interface to sub-select diffraction peaks based on their alignment with specific ring numbers. This step is critical for preparing data for the Grain Indexer, as it allows you to isolate peaks that correspond to known crystallographic planes of your phase.
Functionality#
This widget allows you to:
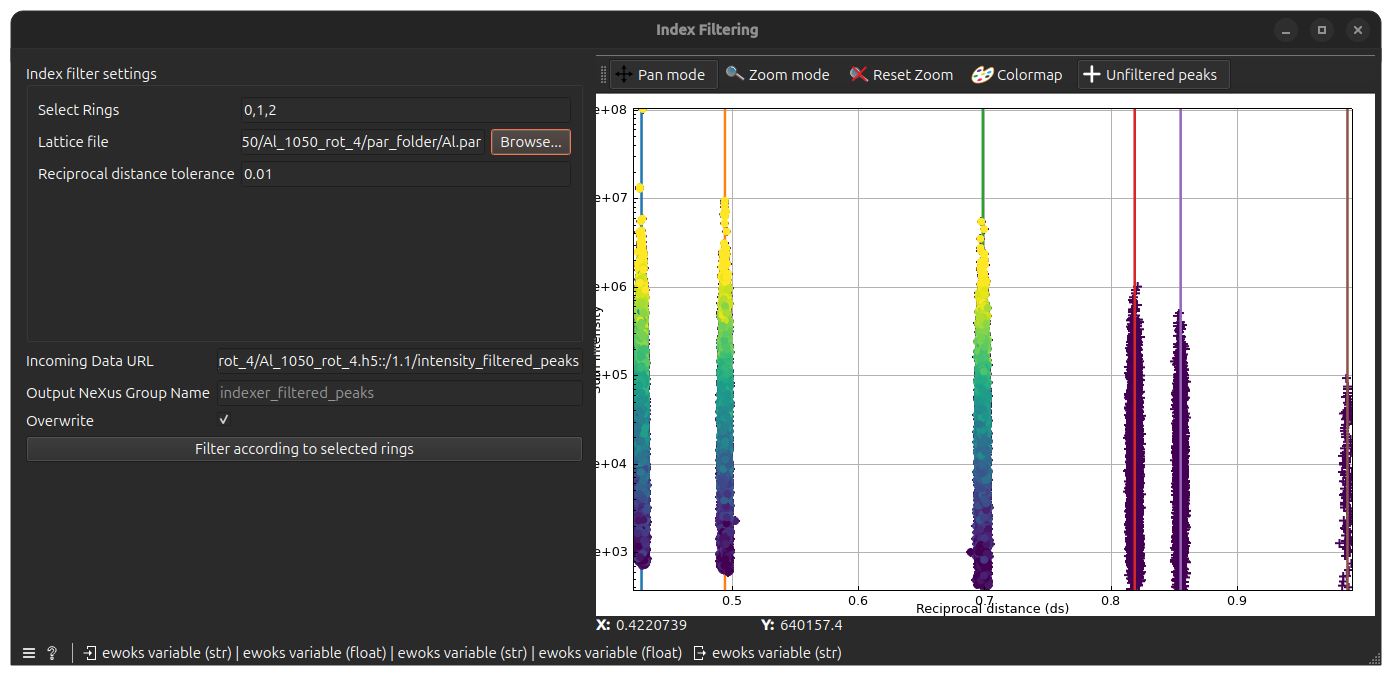
Visualize Peak Distribution: View all incoming peaks in a Reciprocal Distance (\(ds\)) vs. Intensity plot.
Overlay Theoretical Rings: Automatically calculate and plot expected ring positions based on your lattice parameters.
Select Active Rings: Choose which specific rings should be used to filter the data for subsequent indexing.
Inspect Logs: View the internal ImageD11 output to verify ring assignments.
User Interface#
Execution Control#
Process Group Name: The specific HDF5/Nexus path where the filtered peak data will be stored
defaults to
lattice_filtered_peaksfor Lattice filtering.defaults to
intensity_filtered_peaksfor Intensity filtering.defaults to
indexer_filtered_peaksfor Indexer filtering.
Tip:
By assigning a unique name here (e.g., alpha_phase_peaks or beta_phase_peaks), you can process multiple phases within the same data file. This allows you to run independent Indexing and Grain Mapping tasks for each phase subsequently.
Filter Peaks: Executes the filtering.
Overwrite: If checked, existing groups with the same process name will be replaced.
Indexer Log Tab#
A read-only text area displaying the captured standard output from ImageD11. This is useful for debugging ring identification and seeing exactly how many peaks were assigned to each hkl plane.
Example Usage#
Connect the widget to an Intensity Filter output or browse from your folder and select either geometry, lattice or intensity filtered data group.
Ensure the Lattice File and Wavelength (of the beam) are correctly populated from previous nodes.
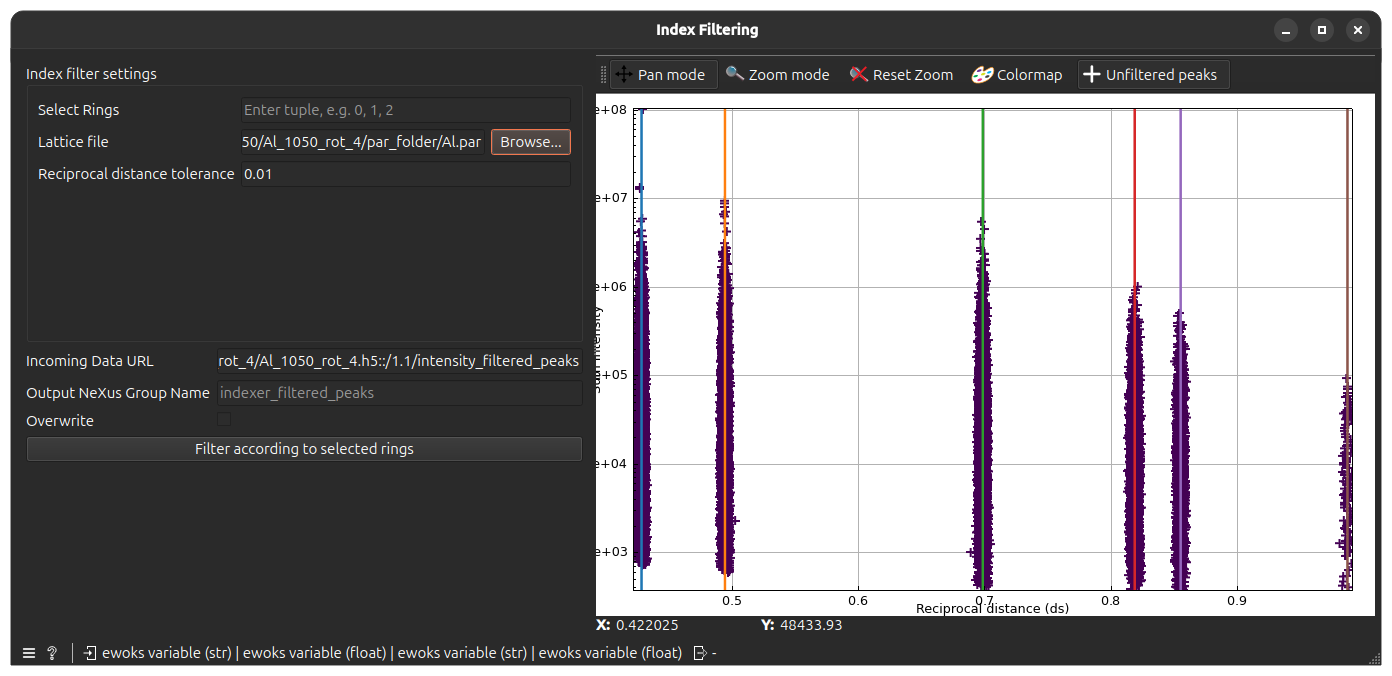
Observe the plot; adjust \(ds\) Reciprocal distance tolerance if the theoretical rings do not align perfectly with the peak clusters.
Select the desired Ring Indices (e.g., 0, 1, 2) for the grains you wish to index.
Click Filter Peaks and verify the result in the plot as well as Indexer Log tab before proceeding to the Indexer widgets.