Detector Correction Widget#
The Detector Correction widget provides a graphical interface to:
correct spatially deformed detector data into a flat plane.
visualize the shift between raw and corrected peak positions.
Functionality#
This widget allows you to:
Load Segmented Peaks: Input a Nexus URL containing your segmented 3D peaks.
Configure Correction: Specify your spline or e2dx/e2dy files.
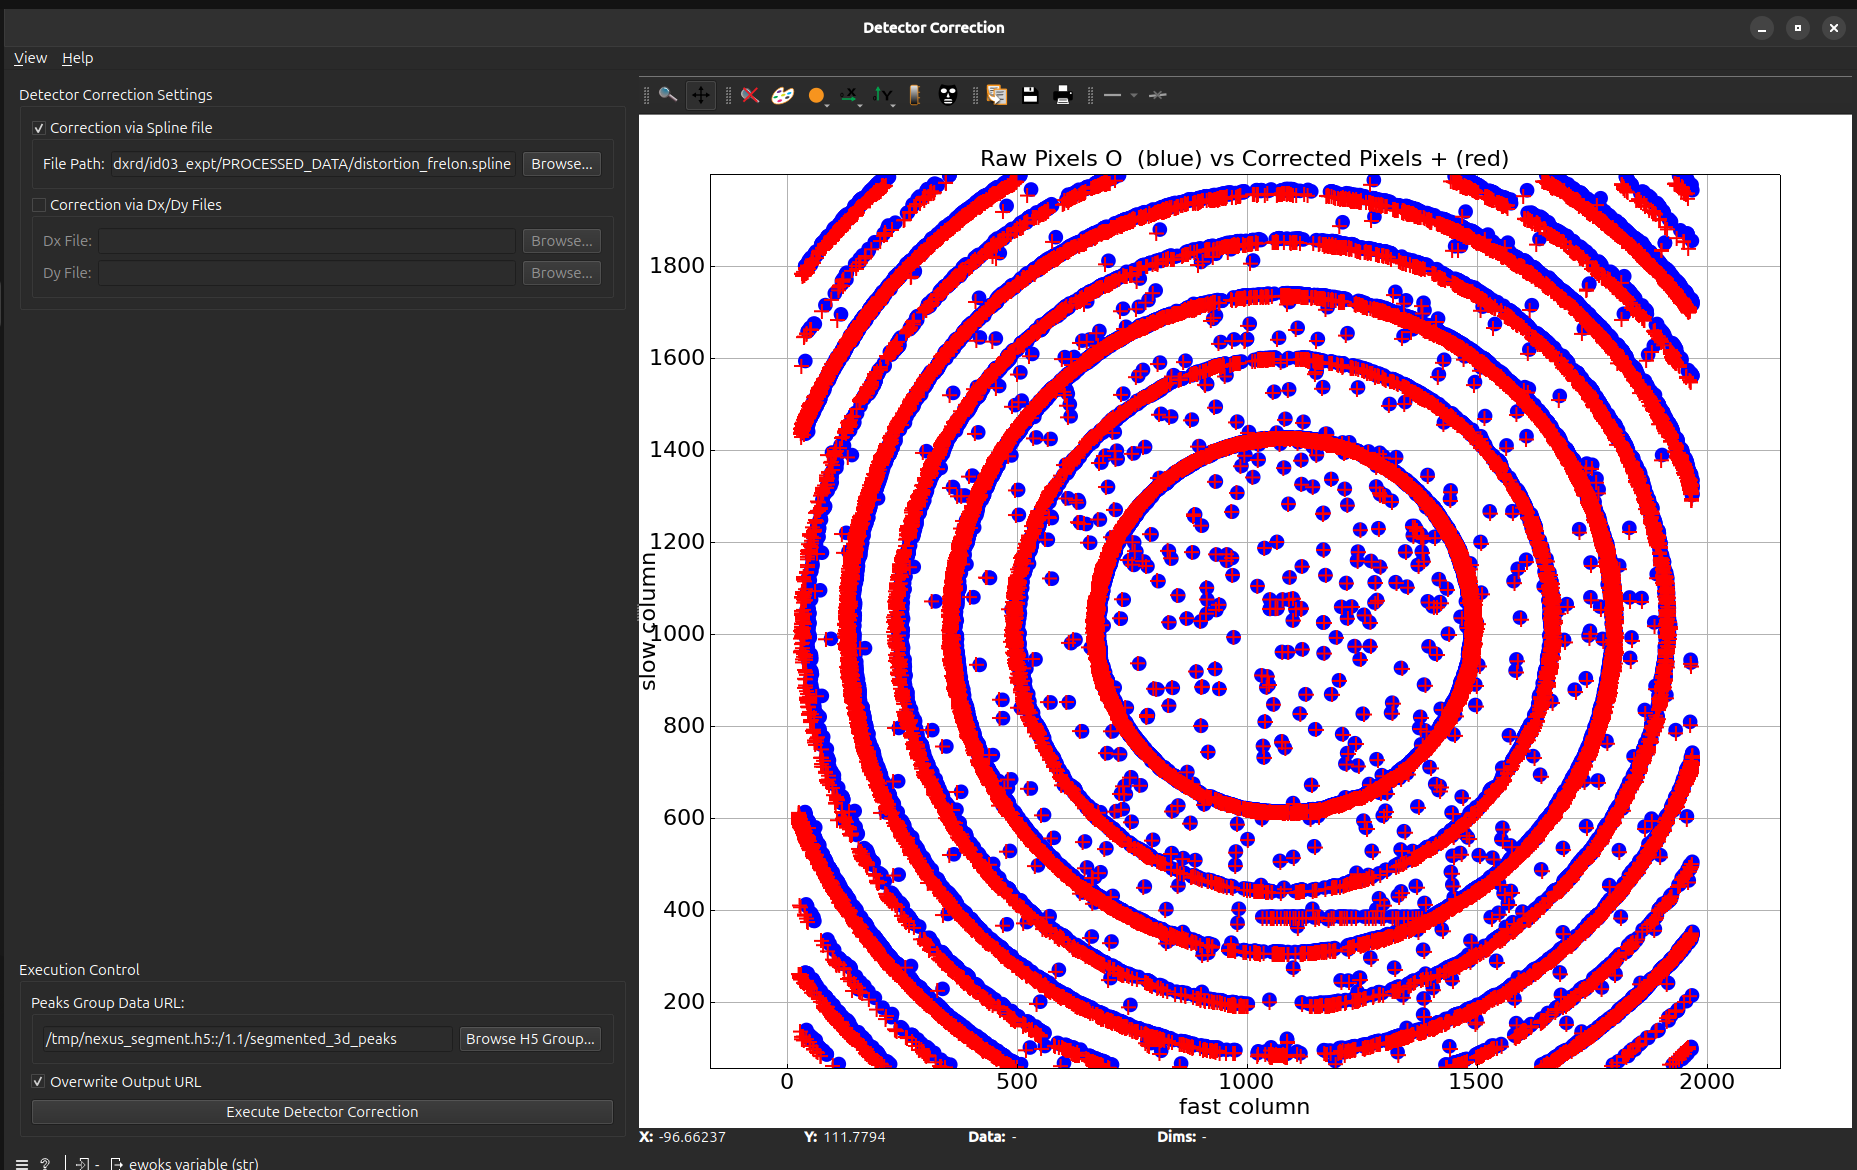
Visualize Results: Compare raw pixels (Blue circles) vs. Corrected pixels (Red crosses)
User Interface#
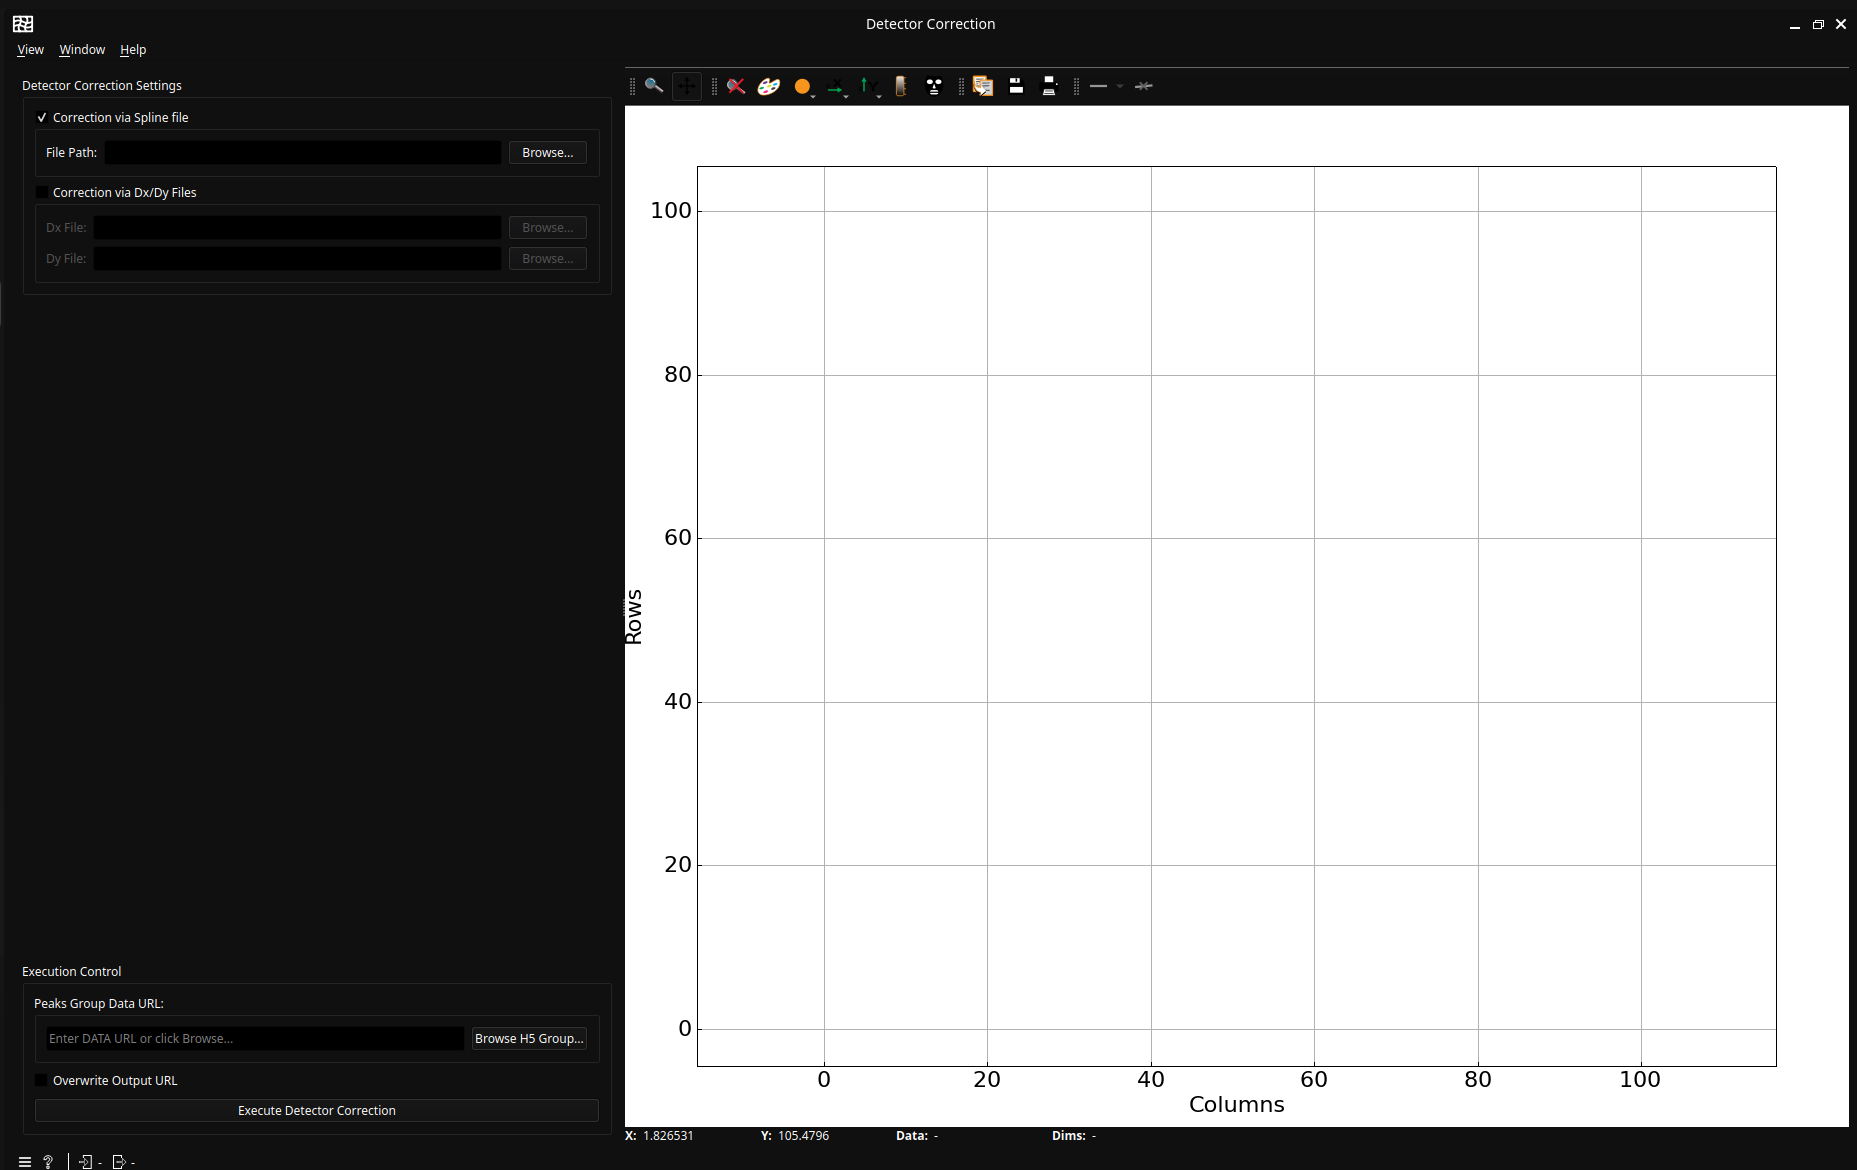
Control Panel#
Detector Correction Settings#
“Correction with spline file”: check if the detector correction should use a spline file (exclusive with “Correction with Dx/Dy file”)
“Correction with Dx/Dy file”: check if the detector correction should use dx/dy file (exclusive with “Correction with spline file”)
Execution Control#
“Execute Detector Correction”: button to trigger the processing.
“Overwrite”: check to overwrite existing results at the expected location.
Plot Area (Right)#
The widget shows the effect of the correction:
Blue circles: Represent the raw pixel positions from the input data.
Red crosses: Represent the spatially corrected positions after execution.
Example Usage#
Connect a widget that outputs a
segmented_peaks_url.Select your
.splinefile in the parameters box.Click Execute. The plot will update to show the overlaid “before and after” coordinates.