Geometry Calibration#
Calibration is an essential step to determine the precise geometric parameters of the experiment (detector tilts, sample-to-detector distance, etc.).
Prerequisites#
Refining these parameters requires 3DXRD data acquired from a “standard” sample with known lattice parameters (typically a Si or CeO₂ single crystal).
Calibration is an essential step to determine accurately the geometric parameters of the experiment (tilt, sample-detector distance, …).
Fitting those require 3DXRD data acquired for a sample with known lattice parameters (usually a Si single crystal).
You can produce an initial .par or .PONI file by using the
pyFAI-calib2 calibration.
While these methods have methods for producing powder calibration and single crystal calibration files, you can use them as a starting point if you use only powder calibration, and if you use single crystal calibration you don’t have to use this GUI for the single-crystal workflow. If you already have approximate geometry parameters, you can bypass the powder step and start directly with single-crystal calibration.
The Calibration Workflow
To begin, navigate to Help > Example workflows and select the 3DXRD Geometry Calibration example.
Preparation: Follow the Segmentation and Detector Correction steps exactly as described in the 3DXRD Data Processing guide.
Executing Fit Geometry#
Double-click the Fit Geometry node to open the refinement interface.
Input Configuration:
Load your Lattice file (defining the crystal structure).
Load your initial Geometry file or manually type the values into the respective group boxes.
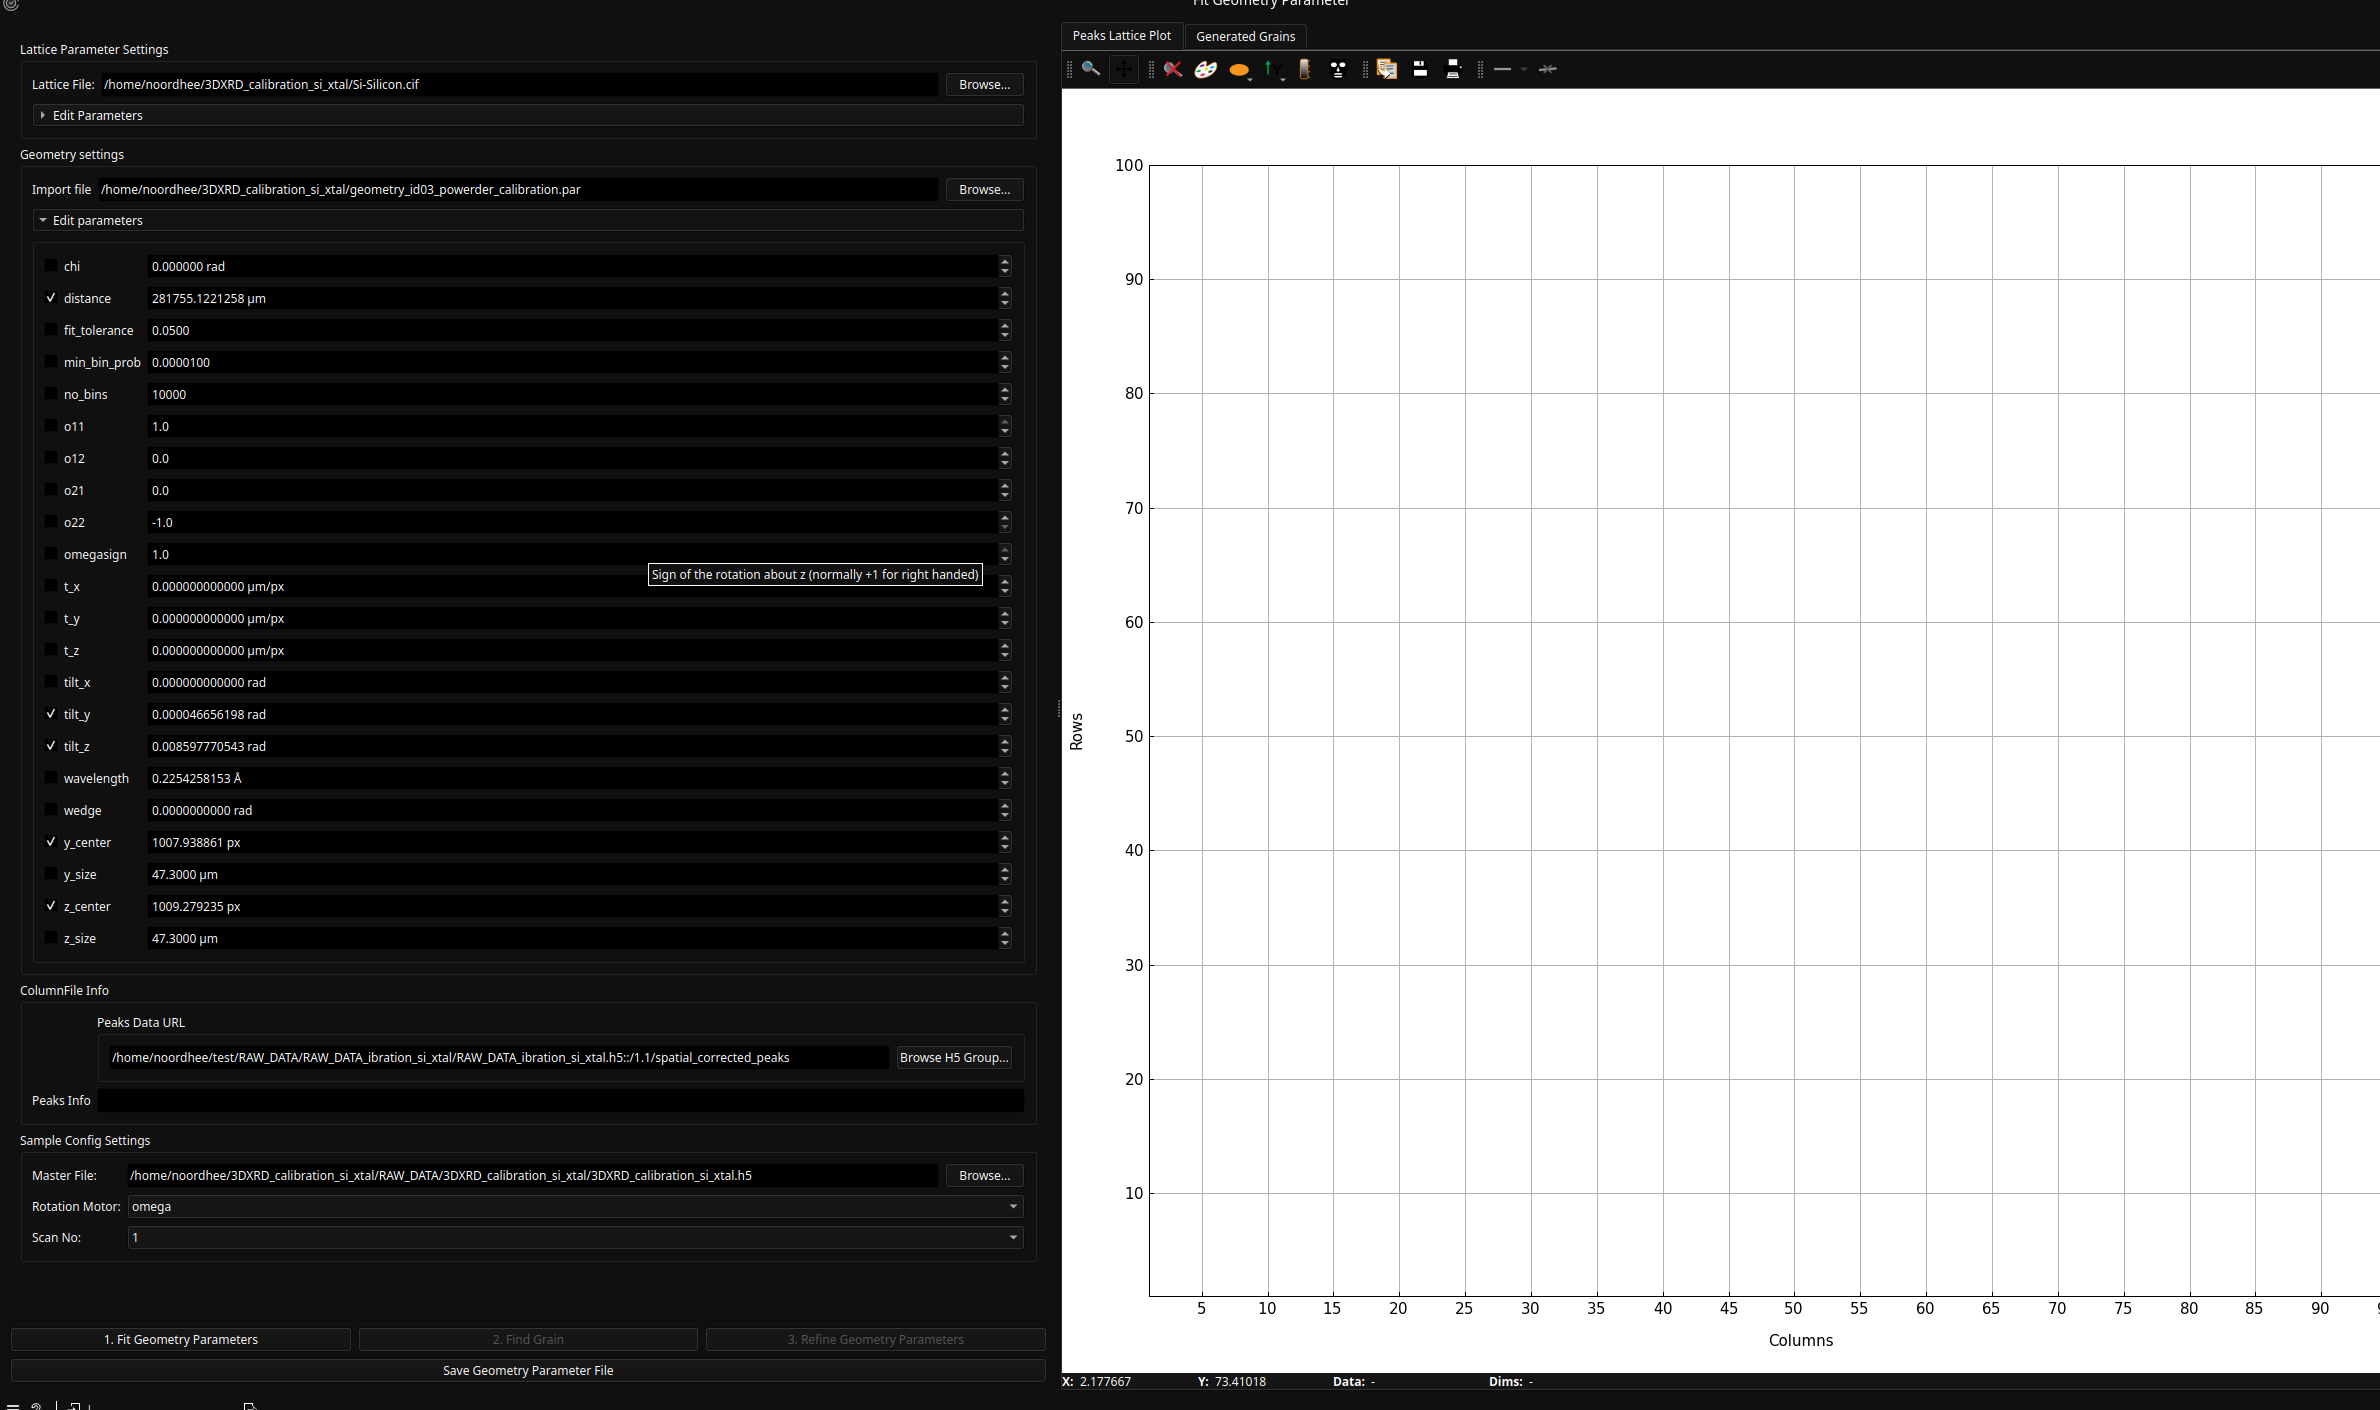
Selecting Parameters to Refine:
Each parameter (distance, tilts, centers) has a checkbox.
Checked: The parameter will be optimized during the fit.
Unchecked: The parameter remains fixed.
Tip: If you are unsure, start with the default checked parameters.
The Iterative Fitting Process#
Follow the numbered steps in the GUI for a successful calibration:
Fit Geometry: Click this to run the fit approximation algorithm based on the current peak positions and selected Geometry and Lattice parameters.
Find Grain: Click this to attempt to index a single grain from the peaks.
Success: The system will identify a grain near the spatial origin (0, 0, 0).
Failure: A pop-up will appear stating “No grain found.” If this happens, re-adjust your initial parameters and retry step 1.
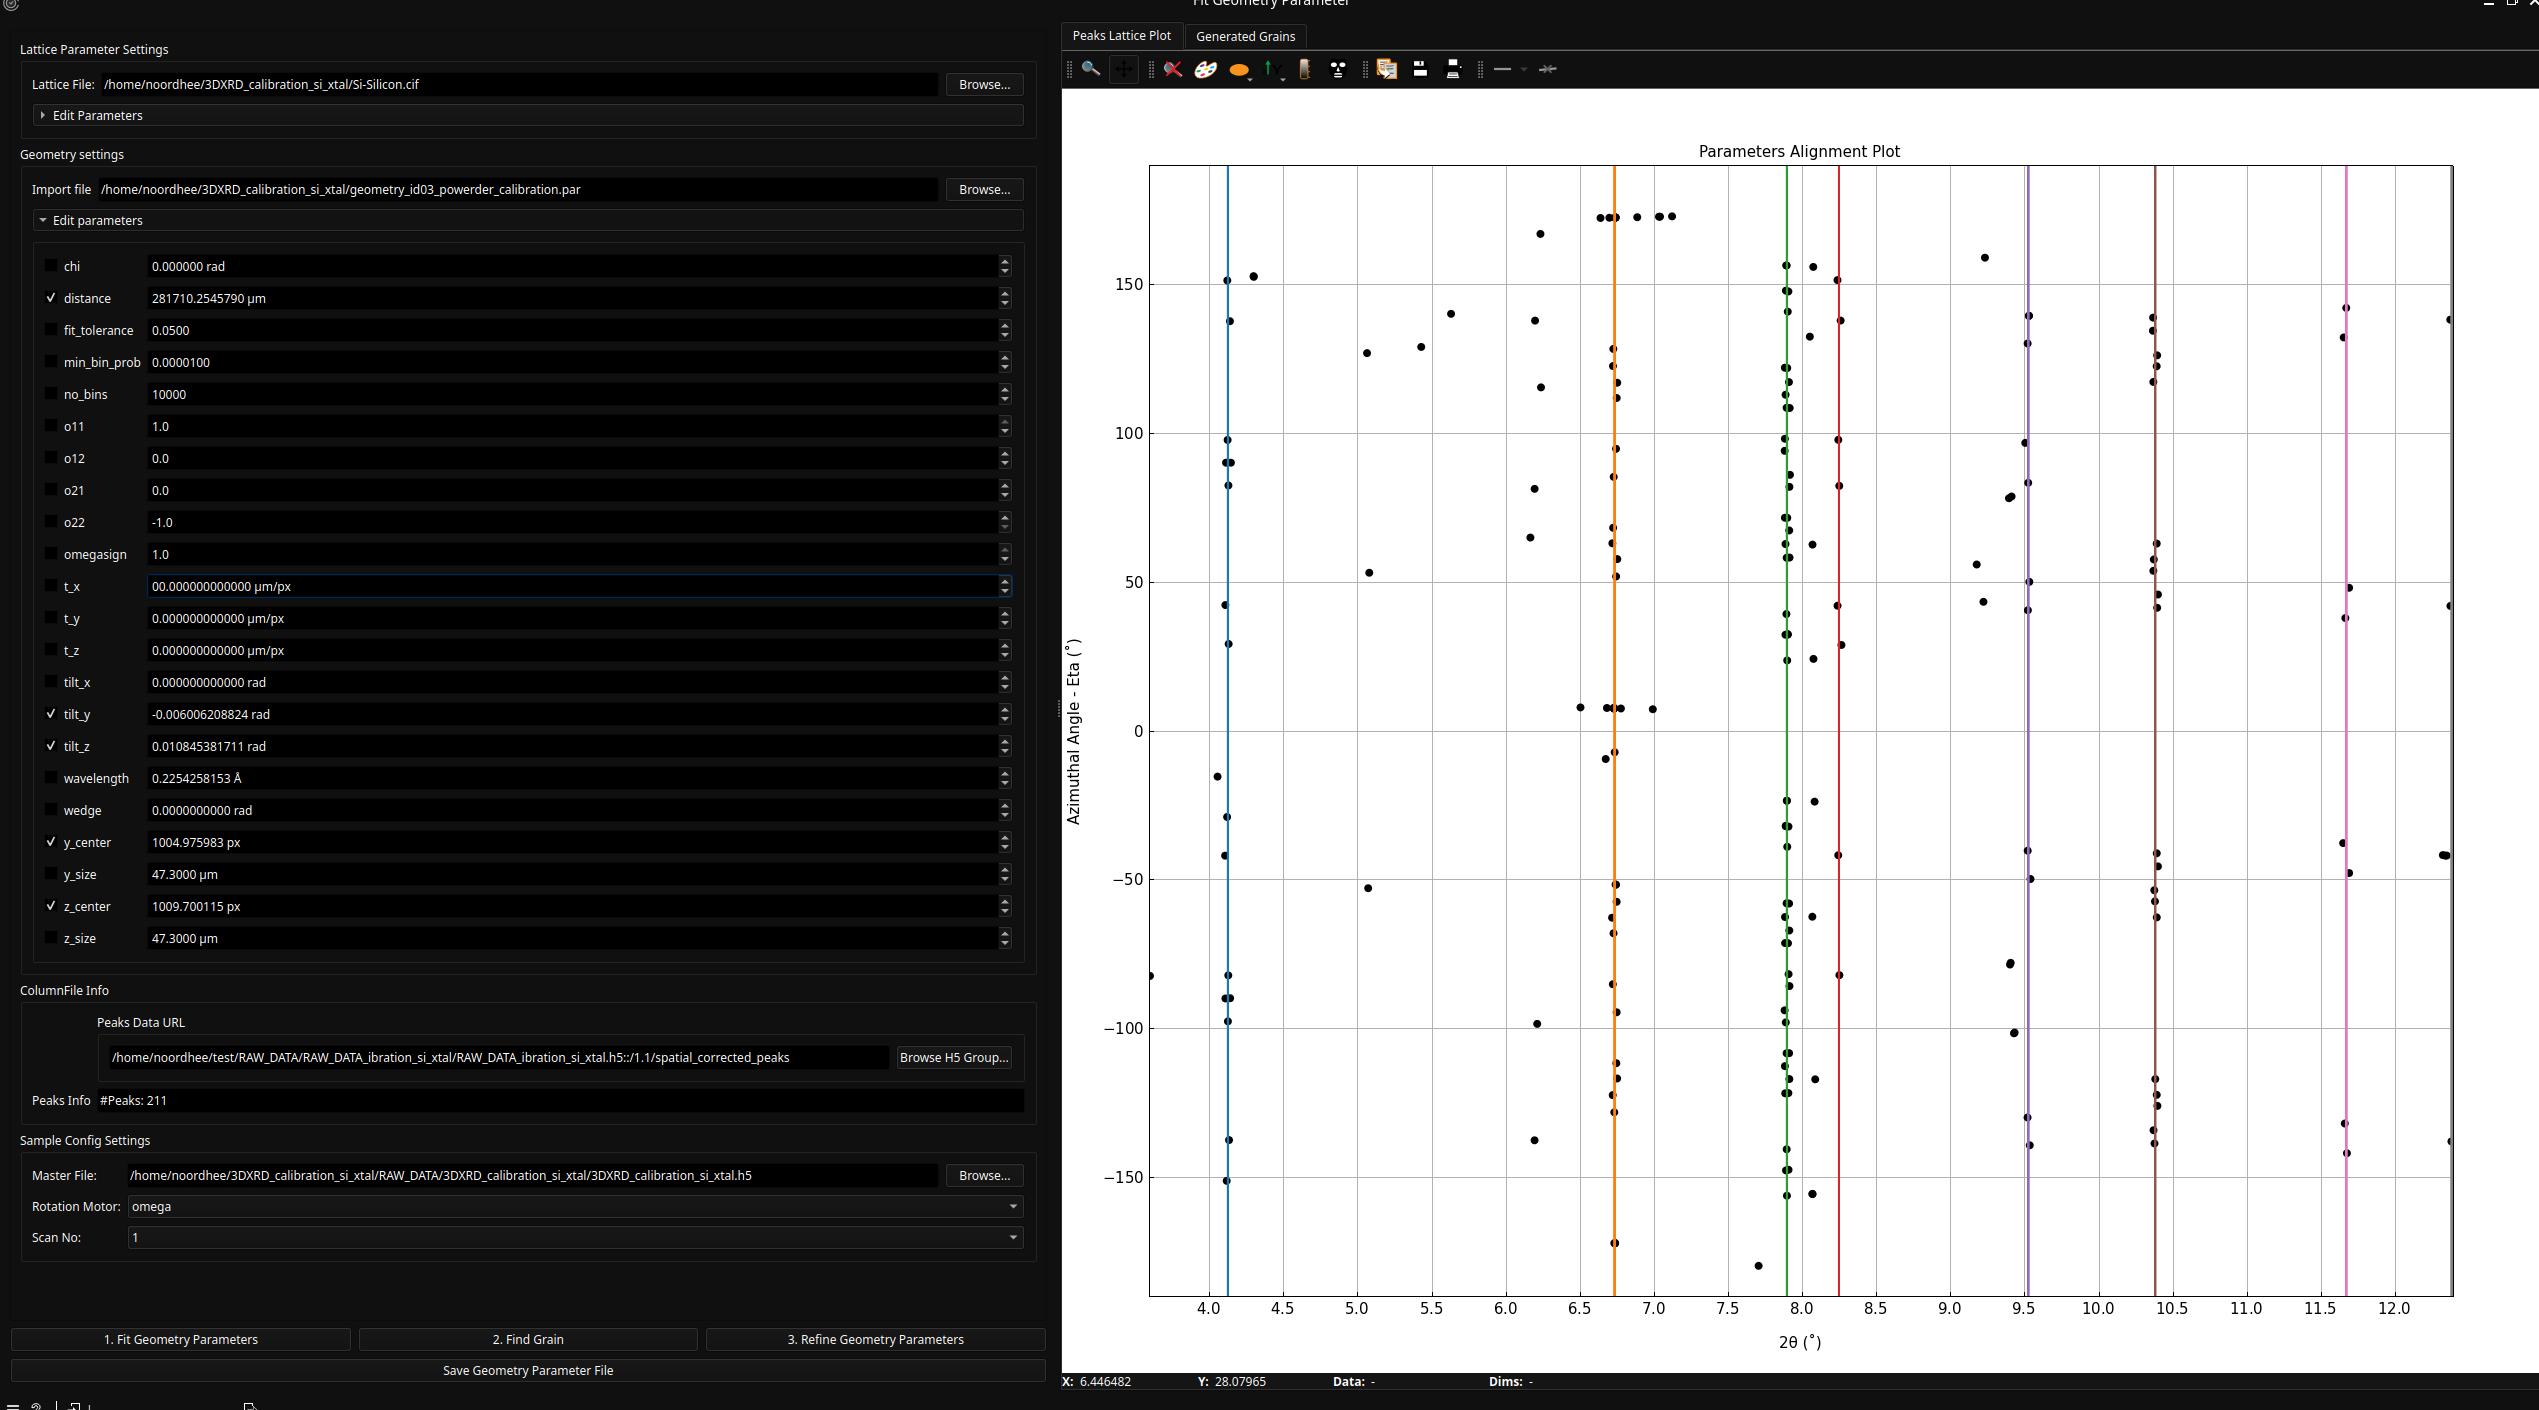
Verifying the Result#
The widget displays a Peaks-Lattice plot. You can visually verify the quality of the fit:
Correct Fit: The ring curves (theoretical) align perfectly with the detected peak markers.
Poor Fit: The rings and peaks are offset or skewed. Continue iterating between Fit Geometry and Find Grains until the alignment is precise.
Once a single grain is found and the rings align with the peaks, your geometry parameters are accurately calibrated and ready for the main data processing workflow.