Intensity Filter Widget#
The Intensity Filter widget allows users to down-select diffraction peaks based on their scattering strength.
Functionality#
This widget allows you to:
Normalize Intensity: Calculate a filtered intensity metric by combining raw sum intensity with a reciprocal distance (\(ds\)) correction.
Threshold Peaks: Apply a fractional cutoff to keep only the most significant reflections.
Visualize the Cutoff: Compare the distribution of all peaks against those that pass the intensity filter in a real-time plot.
User Interface#
Control Panel#
These two parameters work together to define which peaks are “strong enough” to be kept:
Intensity Fraction (intensity_frac): A percentile-based threshold (between 0.0 and 1.0). It defines the global cutoff for the normalized intensity metric.
Example: A value of 0.95 will filter out the weakest peaks, retaining only the top 5% of the normalized signal.
Thermal Factor: This parameter adjusts the filtering strength relative to the reciprocal distance (\(ds\)).
Low values: Treat peaks at low and high \(ds\) similarly.
High values: Increase the “penalty” for peaks at high \(ds\), effectively allowing you to filter weak intensity more aggressively at lower rings while being more “mild” or permissive at higher rings where signal naturally weakens.
Execution Control#
Process Group Name: The specific HDF5/Nexus path where the filtered peak data will be stored
defaults to
lattice_filtered_peaksfor Lattice filtering.defaults to
intensity_filtered_peaksfor Intensity filtering.defaults to
indexer_filtered_peaksfor Indexer filtering.
Tip:
By assigning a unique name here (e.g., alpha_phase_peaks or beta_phase_peaks), you can process multiple phases within the same data file. This allows you to run independent Indexing and Grain Mapping tasks for each phase subsequently.
Filter Peaks: Executes the filtering.
Overwrite: If checked, existing groups with the same process name will be replaced.
Example Usage#
Connect or Load: Connect the widget to a Lattice Filter output or manually browse to a Nexus file containing a filtered data group.
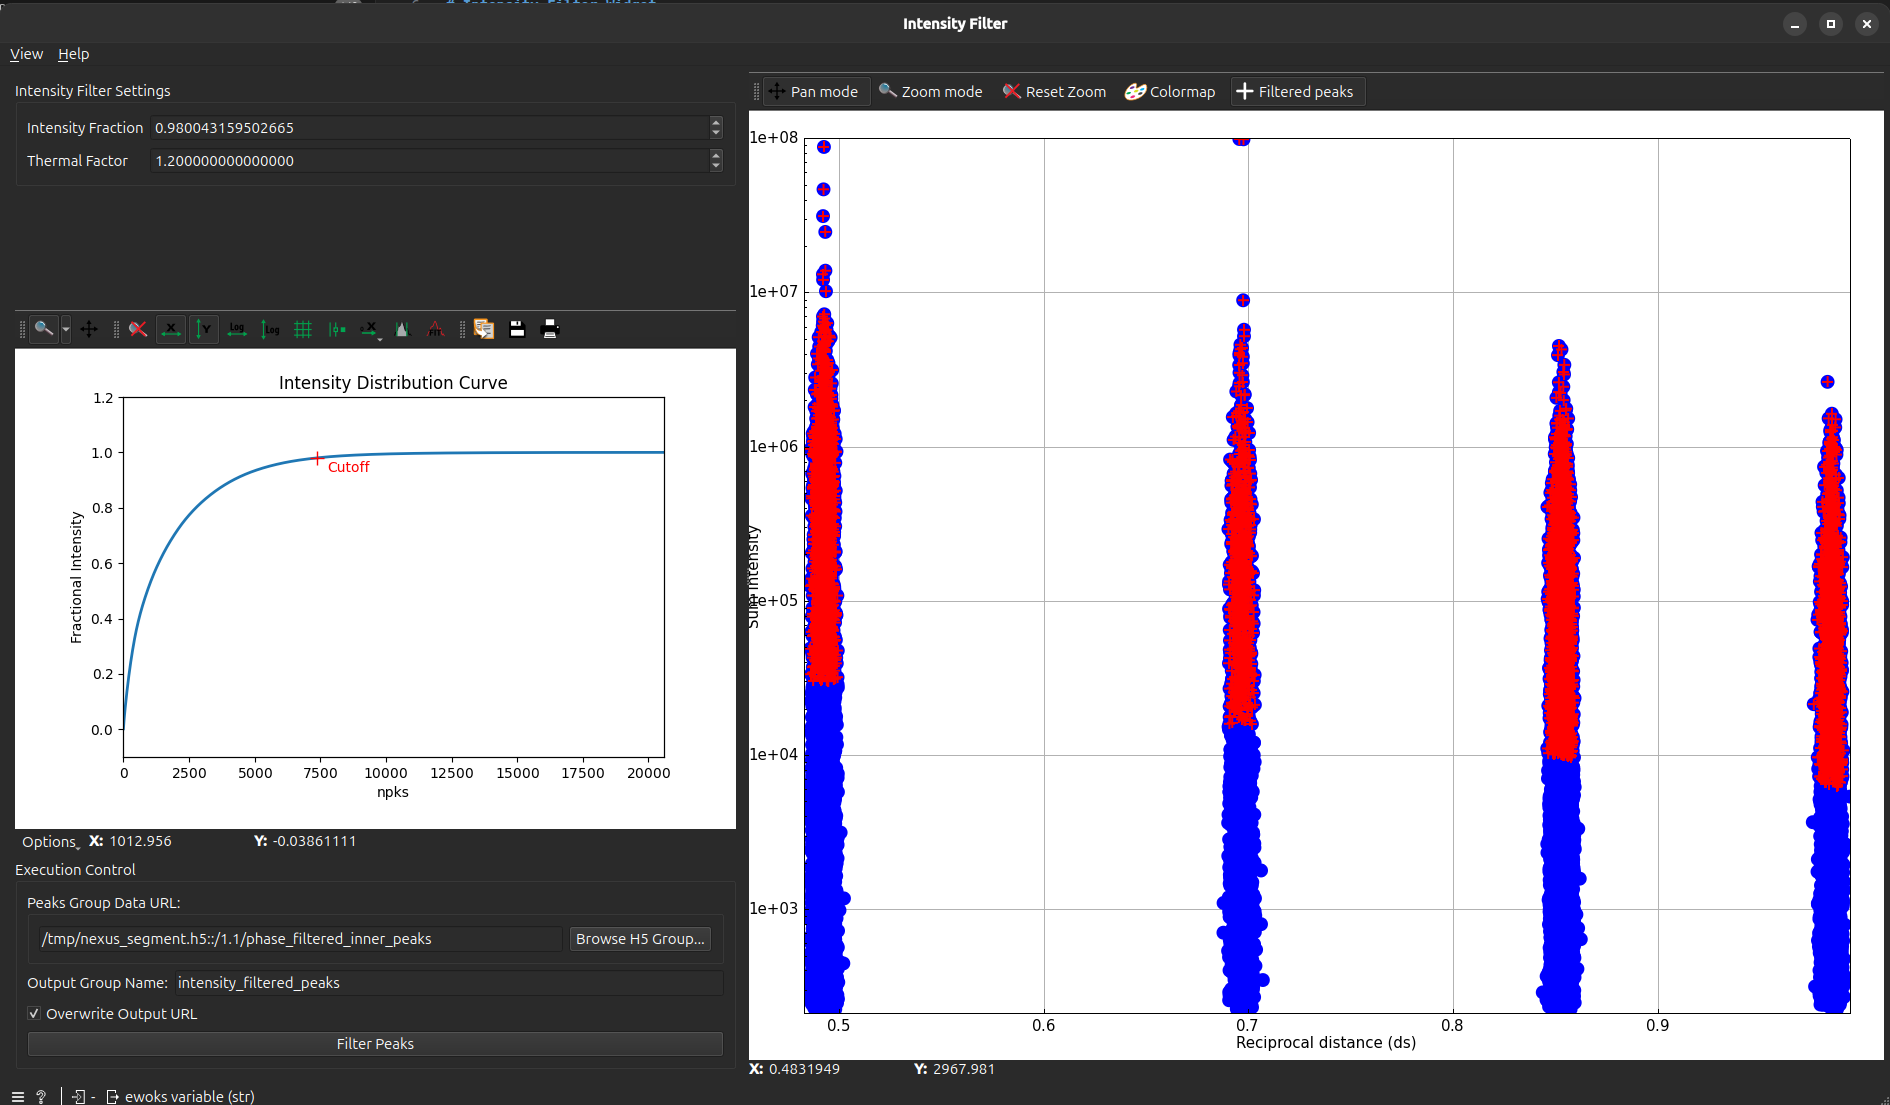
Initial Observation: Observe the blue distribution (unfiltered peaks) in the scatter plot.
Set Global Cutoff: Adjust the Intensity Fraction to set your baseline noise floor (e.g., 0.98).
Refine with Thermal Factor: Adjust the Thermal Factor to fine-tune the filter across the rings. Use higher values if you find that you are losing too many valid peaks at high ds compared to the low \(ds\) region.
Execute: Click Filter Peaks. The red points will indicate the peaks that passed the filter.