
Grid Indexing Widget#
The Grid Indexing widget is the spatial search engine of the 3DXRD pipeline. Grid Indexing performs a positional search across a 3D volume to locate grains and calculate their UBI matrices.
Functionality#
This widget allows you to:
Map Sample Space: Define a 3D search grid (X,Y,Z) corresponding to your sample’s physical dimensions.
Real-Time Monitoring: Observe grain generation dynamically in a 3D scene while tracking numerical progress in the logs.
User Interface#
Configuration#
Sample and Beam Info: (Search Volume) These parameters define the 3D grid where the algorithm will search for grain origins:
Dimensions (X, Y, Z Limits): These should roughly match the illuminated volume of your sample (Sample Width × Sample Depth × Beam Height).
Grid Step: The spacing between search points. A smaller step increases resolution but significantly increases computation time.
Grid Index Settings
Number of Peaks: The minimum number of reflections required to “confirm” a grain’s existence.
Ring 1 & Ring 2: The algorithm pairs peaks from these rings to generate trial orientations.
Attention
Ring 2 must be a subset of Ring 1. If Ring 1 is 0, 1 and Ring 2 is 0, the algorithm tries pairs from (0, 0) and (1, 0).
Tolerance Tuning: A sequence of tolerances (e.g., \((0.02, 0.015, 0.01)\)) used to iteratively refine the grain’s fit.
Execution and Monitoring#
Click Run Grid Indexing to start the execution.
Grid Index Logs: A log manager captures real-time output from the background process, showing grain statistics and tolerance levels.
Visual Feedback:
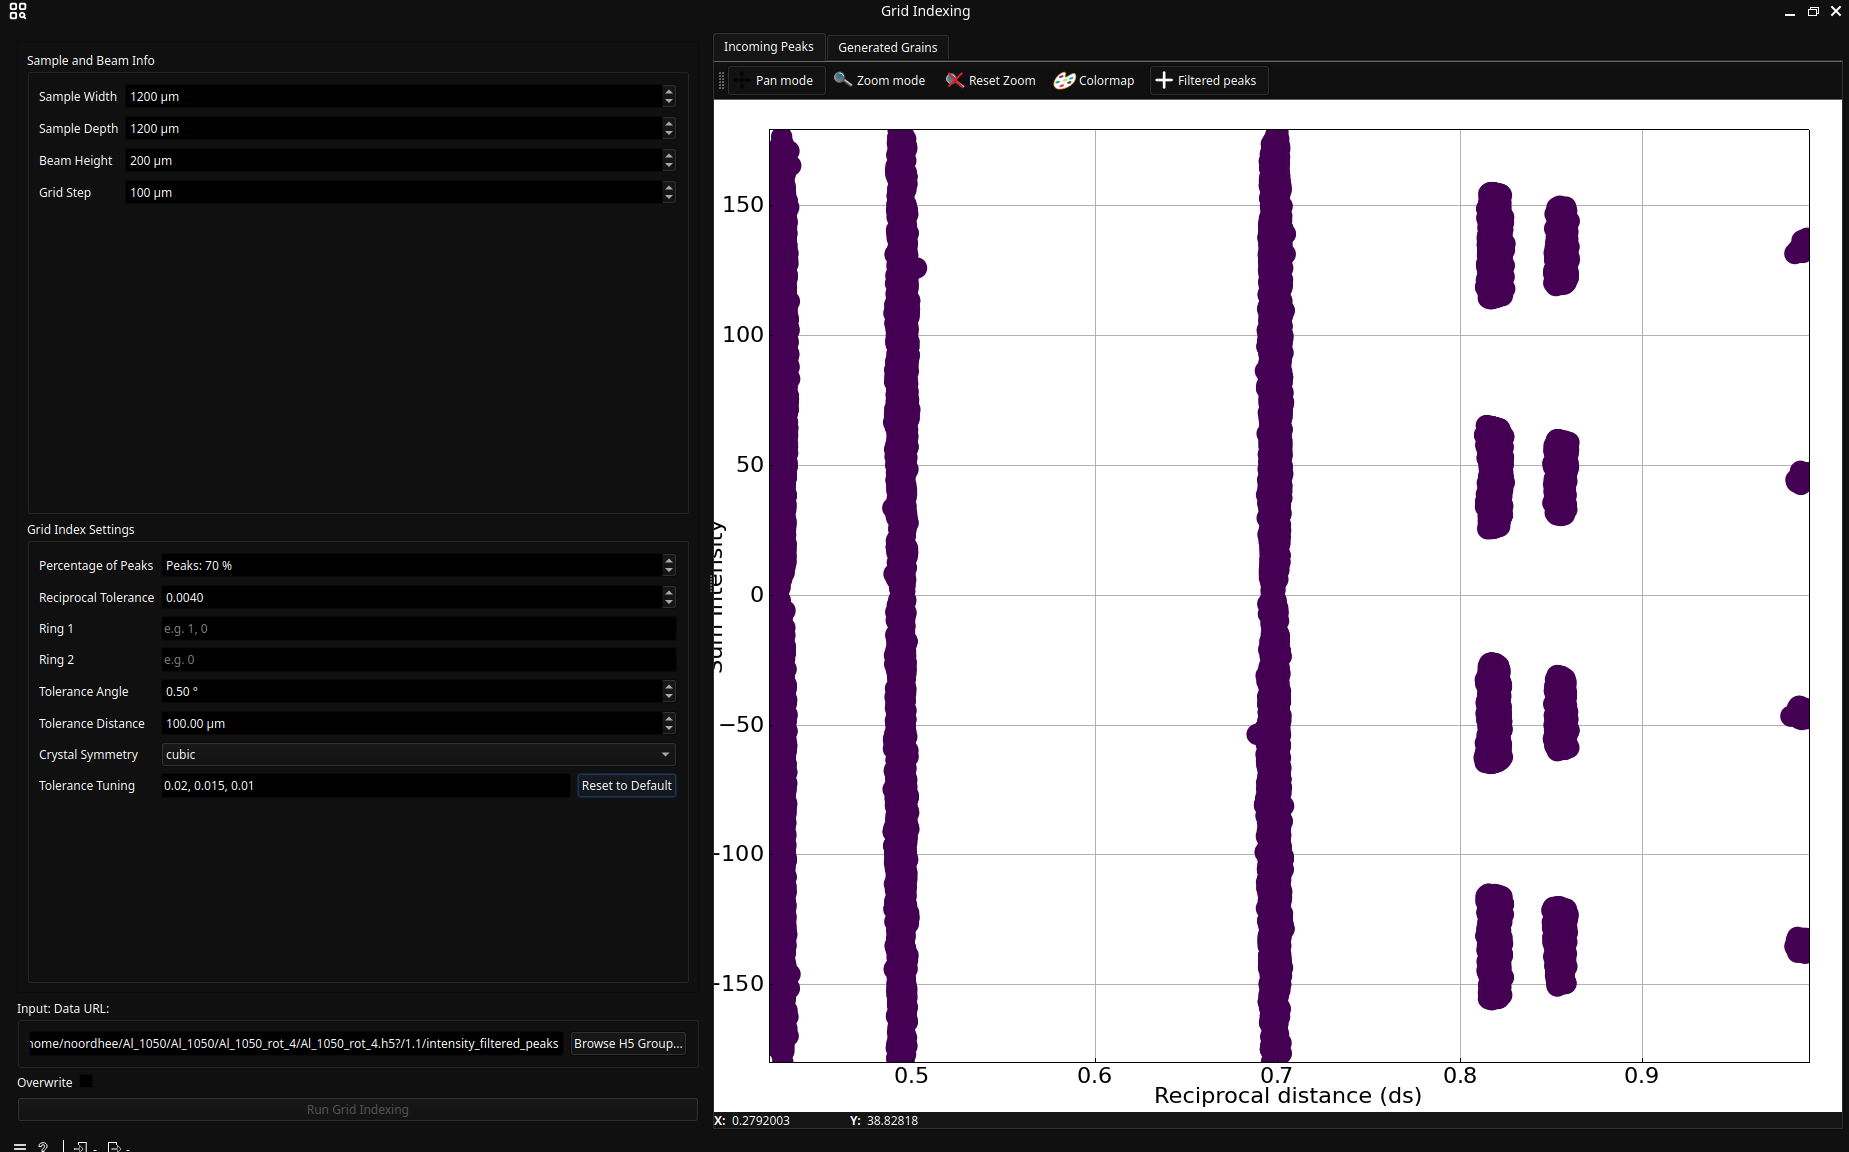
Incoming Peaks Tab: Shows the \(ds\) vs \(\eta\) (or intensity) distribution of peaks before indexing.
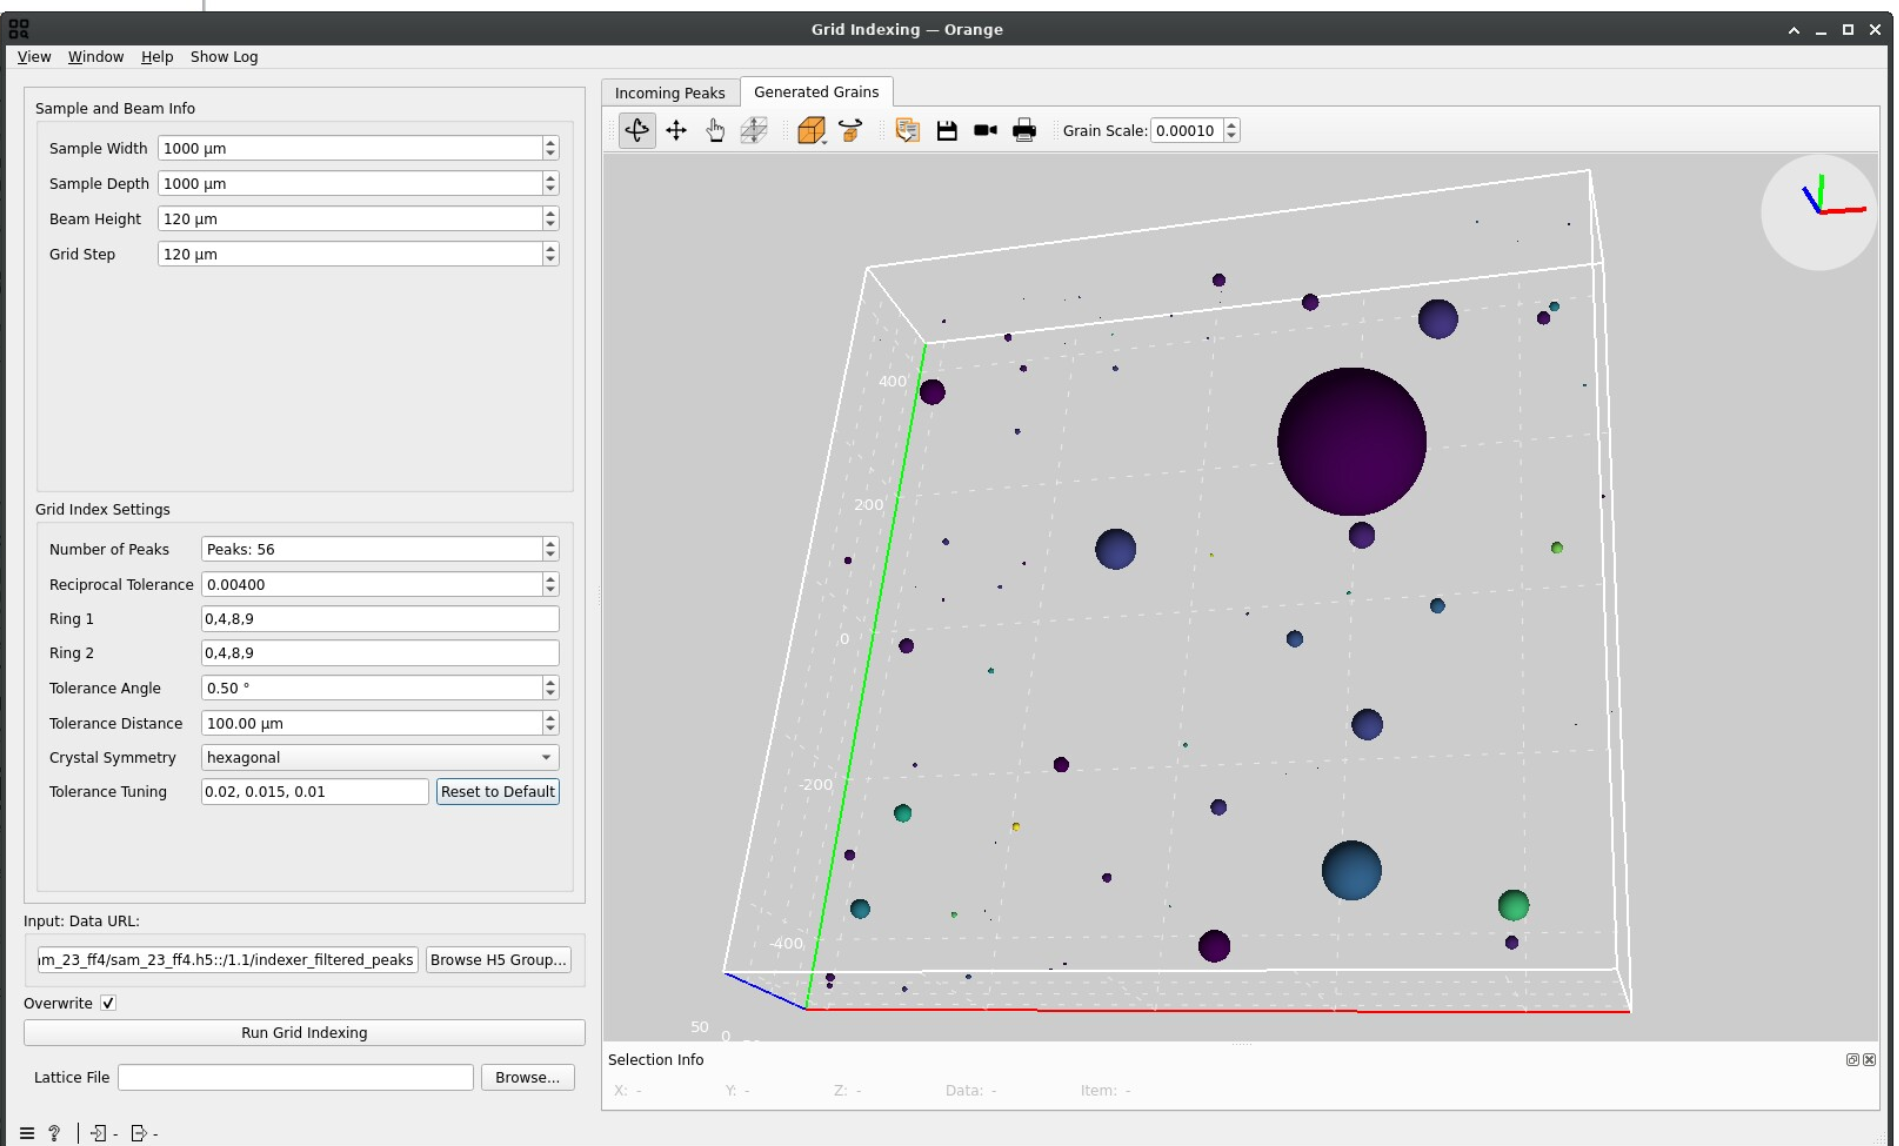
Generated Grains Tab: A 3D scene where grains appear as spheres.
Size: Represents the mean intensity of associated peaks.
Color: Represents the number of peaks assigned to that grain.
Evaluating Results#
Manual validation is critical. A “good” indexing result typically shows:
Logical Distribution: Grains should be contained within the physical sample boundaries.
Low Overlap: While some overlap is expected (as spheres are only approximations of real grain shapes), excessive overlap suggests geometry errors or poor ring selection.
Consistent Count: The number of grains should align with the expected crystallinity of your sample.
Troubleshooting#
Empty Grain List: Try decreasing the Number of Peaks requirement or broadening the Tolerance Sequence.
High Grain Count/Noise: Revisit the Intensity Filter to remove weak signal or ensure no peaks were detected outside the diffraction spots during Segmentation.
Grains Outside Sample: Check your Geometry Transformation parameters; the instrument center or detector distance might be slightly off.